
As our “small plugin shop” starts growing into something not so “small” anymore, our Support has to grow as well. We’re now two full-time workers and one part-time worker. At our current rate we’ll need two more full-time workers one year from now. How do I know that? Data.
For 100 years now, a person has walked to the very end of the Scripps Pier in San Diego, dipped a bucket into the water, took its temperature, and recorded it in a log. Every single day. For 100 years. There are volunteers that do this to this day and they say that there’s a bit of ominous pressure to not be the one who forgets to dip the bucket on their day.
Over this period of time, there have been huge advancements in oceanography, specifically more precise methods of measuring temperature, and even automated ways to do it. Regardless, these scientists and volunteers have continued the exact same method every day for 100 years. Why? Reliable data on trends.
The results of their consistency over the last 100 years is that they now have unarguable data about the rising temperatures of the ocean. Their granular data, measured by the exact same method every time, recorded and analyzed is something worth paying attention to, and cannot be disputed.
When we talk about Scaling Your Support Team, it means gathering data, solidifying your method, reporting it consistently, and having a plan for growth. I’ll be sharing my experience with growing our small team based on the data and methods I’ve been developing over the past year. Full Disclosure though, we are a small team. Currently just three members. My plan is that what I’m sharing with you now is my blueprint for our future.
Dipping Your Bucket Every Day
It’s easy to dismiss the idea that the ocean is warming if you only go surfing every December. It gets a lot harder to argue against it when faced with over 35,000 days of raw data and analysis. Getting that data is all about dipping your bucket every single day.
So step one isn’t “Figure out how to scale.” Step one is simply: Dip the bucket. Collect all the data you can possibly collect. Because you don’t know what you don’t know until you start collecting data.
Gathering actionable data means several things:
- Having the tools necessary to measure the correct data reliably
- Having the ability to record that data somewhere that will survive over the years
We we first launched our Priority Support, we were using bbPress. It has a lot of benefits. We liked the public aspect to it and how others — even free users — could browse the forums and find their answers. But when we started getting serious about scaling, we quickly decided that we didn’t have any actionable data on how long individual tickets took to answer or the interval between when a ticket was submitted and when it was answered or even generally how happy or bothered folks were about the support they received.
So before we could even think about scaling we needed to get on a system that would give us the data we need in order to measure and evaluate the effectiveness of our Support. For us, we chose HelpScout.
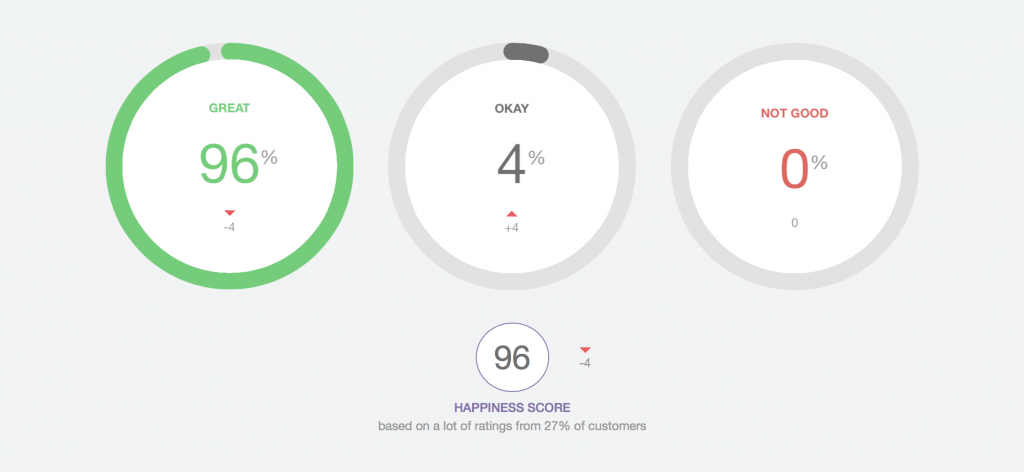
HelpScout provides a lot of data. It tracks how long you spend on every conversation. It reports to you how many replies — on average — it takes before an issue is closed. It has a rating system built into every reply so users can tell us how they feel about the support they are receiving.
But Help Scout isn’t our only source of data. Support is definitely directly impacted by sales, so sales data is important to collect as well. For that we have Easy Digital Downloads or you can use your Payment Gateways or Accounting Software.
So, between those two sources we already have a ton of data. There’s certainly more points of data that can be added. I’m just focusing on Support ticket data and Sales data. But the data that you need depends on your business setup and your Support system. What’s most important is that you identify the items which most directly impact your support load.
Keep in mind that gathering data is not the same as reporting data or analyzing data. At this time you don’t know a whole lot about how much time you spend on support, so you just want to keep dipping your bucket every single day without any thought as to what it will tell you or how long you’ll have to dip it — just keep dipping.
Reporting
Reporting sounds amazingly boring. And it is. It’s terrible. But it’s the only thing that will make sense of all the data you’re collecting. I spend about 45 minutes of every Monday generating our weekly “Support Report.” It’s tedious work, but once it’s done I can stand back a bit and see the bigger picture of what the data means and that’s when I start to get excited.
Take our Scripps Pier example again. Here’s the raw daily data they collected over 100 years.

Awesome, right? But can you make sense out of that at all? No way!
In order to make sense of the data, you have to report on it. You have to take all those dips of the bucket, and put them into a report that is easily understandable. This requires looking at the data in a variety of ways, not just the raw data itself.
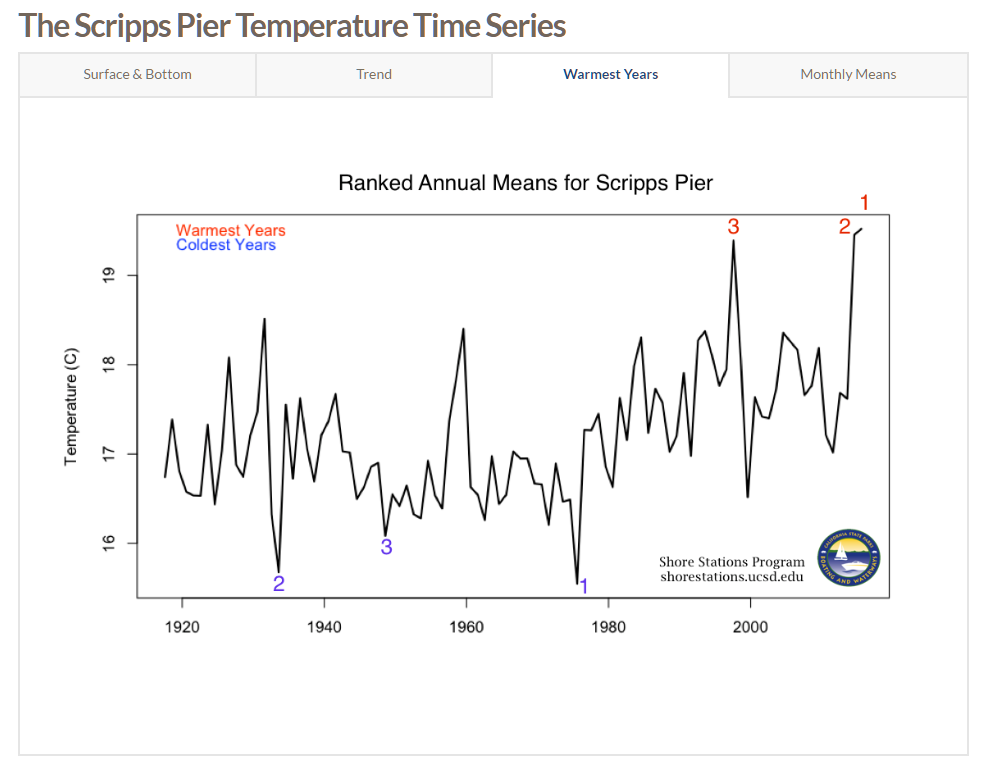
Contrary to the never-changing way you gather your data, you can change the way you report it just fine. As long as the data is always available, you can always go back and do different reports historically and moving forward. For example, here’s the same 100 years of data, but presented as each years mean. This allowed them to show clearly the three hottest and coldest years on record.
Back to what we’re doing at WordImpress. I started by reporting the data fairly raw. My early reports were very low on analysis. But each week I’d notice a different data point that might be noteworthy or a combination of data points that might be affecting each other.
For example, one very obvious pair of data points are how many sales in a week, compared to how many support conversations. I first reported these things by themselves, but eventually I started reporting on a Sales-to-Conversations ratio.
That Sales-to-Conversations ratio ends up being really important. This number is constantly in flux, but it basically tells me how much support is being generated per sale. If I know that, I can then inflate it to see what it would look like if sales suddenly doubled, or tripled.
That ratio can also be an indicator of the health of our plugins. On average we’re generating about 1.2 new tickets per sale. If that number were to spike to 1.5 or even 2 then most likely there’s an underlying development issue we need to address to improve the overall user experience of our plugins.
Understanding Your Current Capacity
Now that we’re collecting data and we can report on it in different ways, we are close to being able to quantify our capacity. First though, we have to understand what capacity is.
Capacity is the workload your current team is able to perform without other things falling apart. In Support, capacity is king.
It’s important to define what a healthy amount of ticket-time is for your support staff. Anyone who says that full-time Support should be on tickets full-time does not have your best interests in mind — IMHO.
Currently at WordImpress, we have one part-time support dev who does 10 hours a week on Priority Support tickets only. Our Senior Support Tech, Ben Meredith, is full-time but we limit his time on priority tickets to only 25 hours a week; and I commit to 20 hours maximum. That’s 55 hours available a week only for Priority Support tickets. That’s not Documentation, beta testing of new versions, it’s not Free Support, or meetings, or writing blog articles. It’s 55 hours available of answering support tickets.
Of course, you’ll notice that I could spend more time on tickets, or Ben could as well. We could also ask Steve to pick up an extra 5-10 hours a week. That’s healthy, though. Our expectation is that we have 55 hours a week available for priority support, but that can flex when necessary. Once we spend more than that allotted amount of time on priority support, we know that something is out of wack.
The next trick is being able to know when that capacity is getting filled up BEFORE it happens.
My Capacity Formula
With all of that in mind, here’s what I currently use for my Capacity Calculator:

This is what it does:
- Cells with dashed borders can be changed or input weekly
- Yellow cells are automatically calculated
- It calculates our total amount of available hours in minutes (because conversations on tickets happen in minutes)
- It takes our total number of minutes and calculates how many conversations we can support based on how quickly we are currently resolving conversations
- It takes our total number of minutes, and time per conversation, and Sales-to-Conversations ratio and says how many sales we can support.
What this means is, there are multiple ways for us to scale our Support. The immediate answer might not always be to hire new people. It might be that we start getting a lot more conversations per sale simply because our products start to get attention from very beginning users who have a lot of questions. If that’s the case then we might see a spike in our capacity, but it could slow down again once these new users are more comfortable with the plugins.
We might also start to see our ability to resolve tickets more quickly happen. That would mean we can then resolve more tickets in less time. Resolving more tickets in less time means we can support more sales with the same team we currently have.
Will this Actually Work?
Like I mentioned, we’re currently a team of three. This will all be severely tested once we reach our max capacity or when our sales uptick significantly. I work closely with our Business Director, Jason Knill, and we both make projections on our future sales and discuss at which point in those projections we need to consider hiring new support. The only way we can have an informed discussion about that is with this data that I collect every week.
So currently, I’m not overly concerned about this method failing. No matter what, it’s already providing me with a lot of invaluable insight into our business and how I’m leading our Support team.
In Presentation Form
I presented this information at WordCamp Los Angeles earlier this month. It was helpful to talk with other small shops who were struggling with the question of scaling their Support and hear their joy at seeing the data I shared and the calculator. I hope it’s useful to you and your team as well.
Slides and the live Video from WordPress.tv are available here:
Thanks for sharing, Matt!
Fantastic post as always. Seems so simple but so many people stop dipping the bucket and lose the value of all their prior info.